VWO (Vanguard FTSE Emerging Markets ETF)
| name | VWO (Vanguard FTSE Emerging Markets ETF) |
| type | Stock ETF |
| index | FTSE Emerging Markets All Cap China A Inclusion Index |
| mkt cap | All Cap |
| style | Blend |
The index measures the investment return of stocks issued by companies located in emerging market countries. The fund employs an indexing investment approach designed to track the performance of the FTSE Emerging Markets All Cap China A Inclusion Index. It invests by sampling the index, meaning that it holds a broadly diversified collection of securities that, in the aggregate, approximates the index in terms of key characteristics.
| Lifetime Return | Start Date | End Date |
|---|---|---|
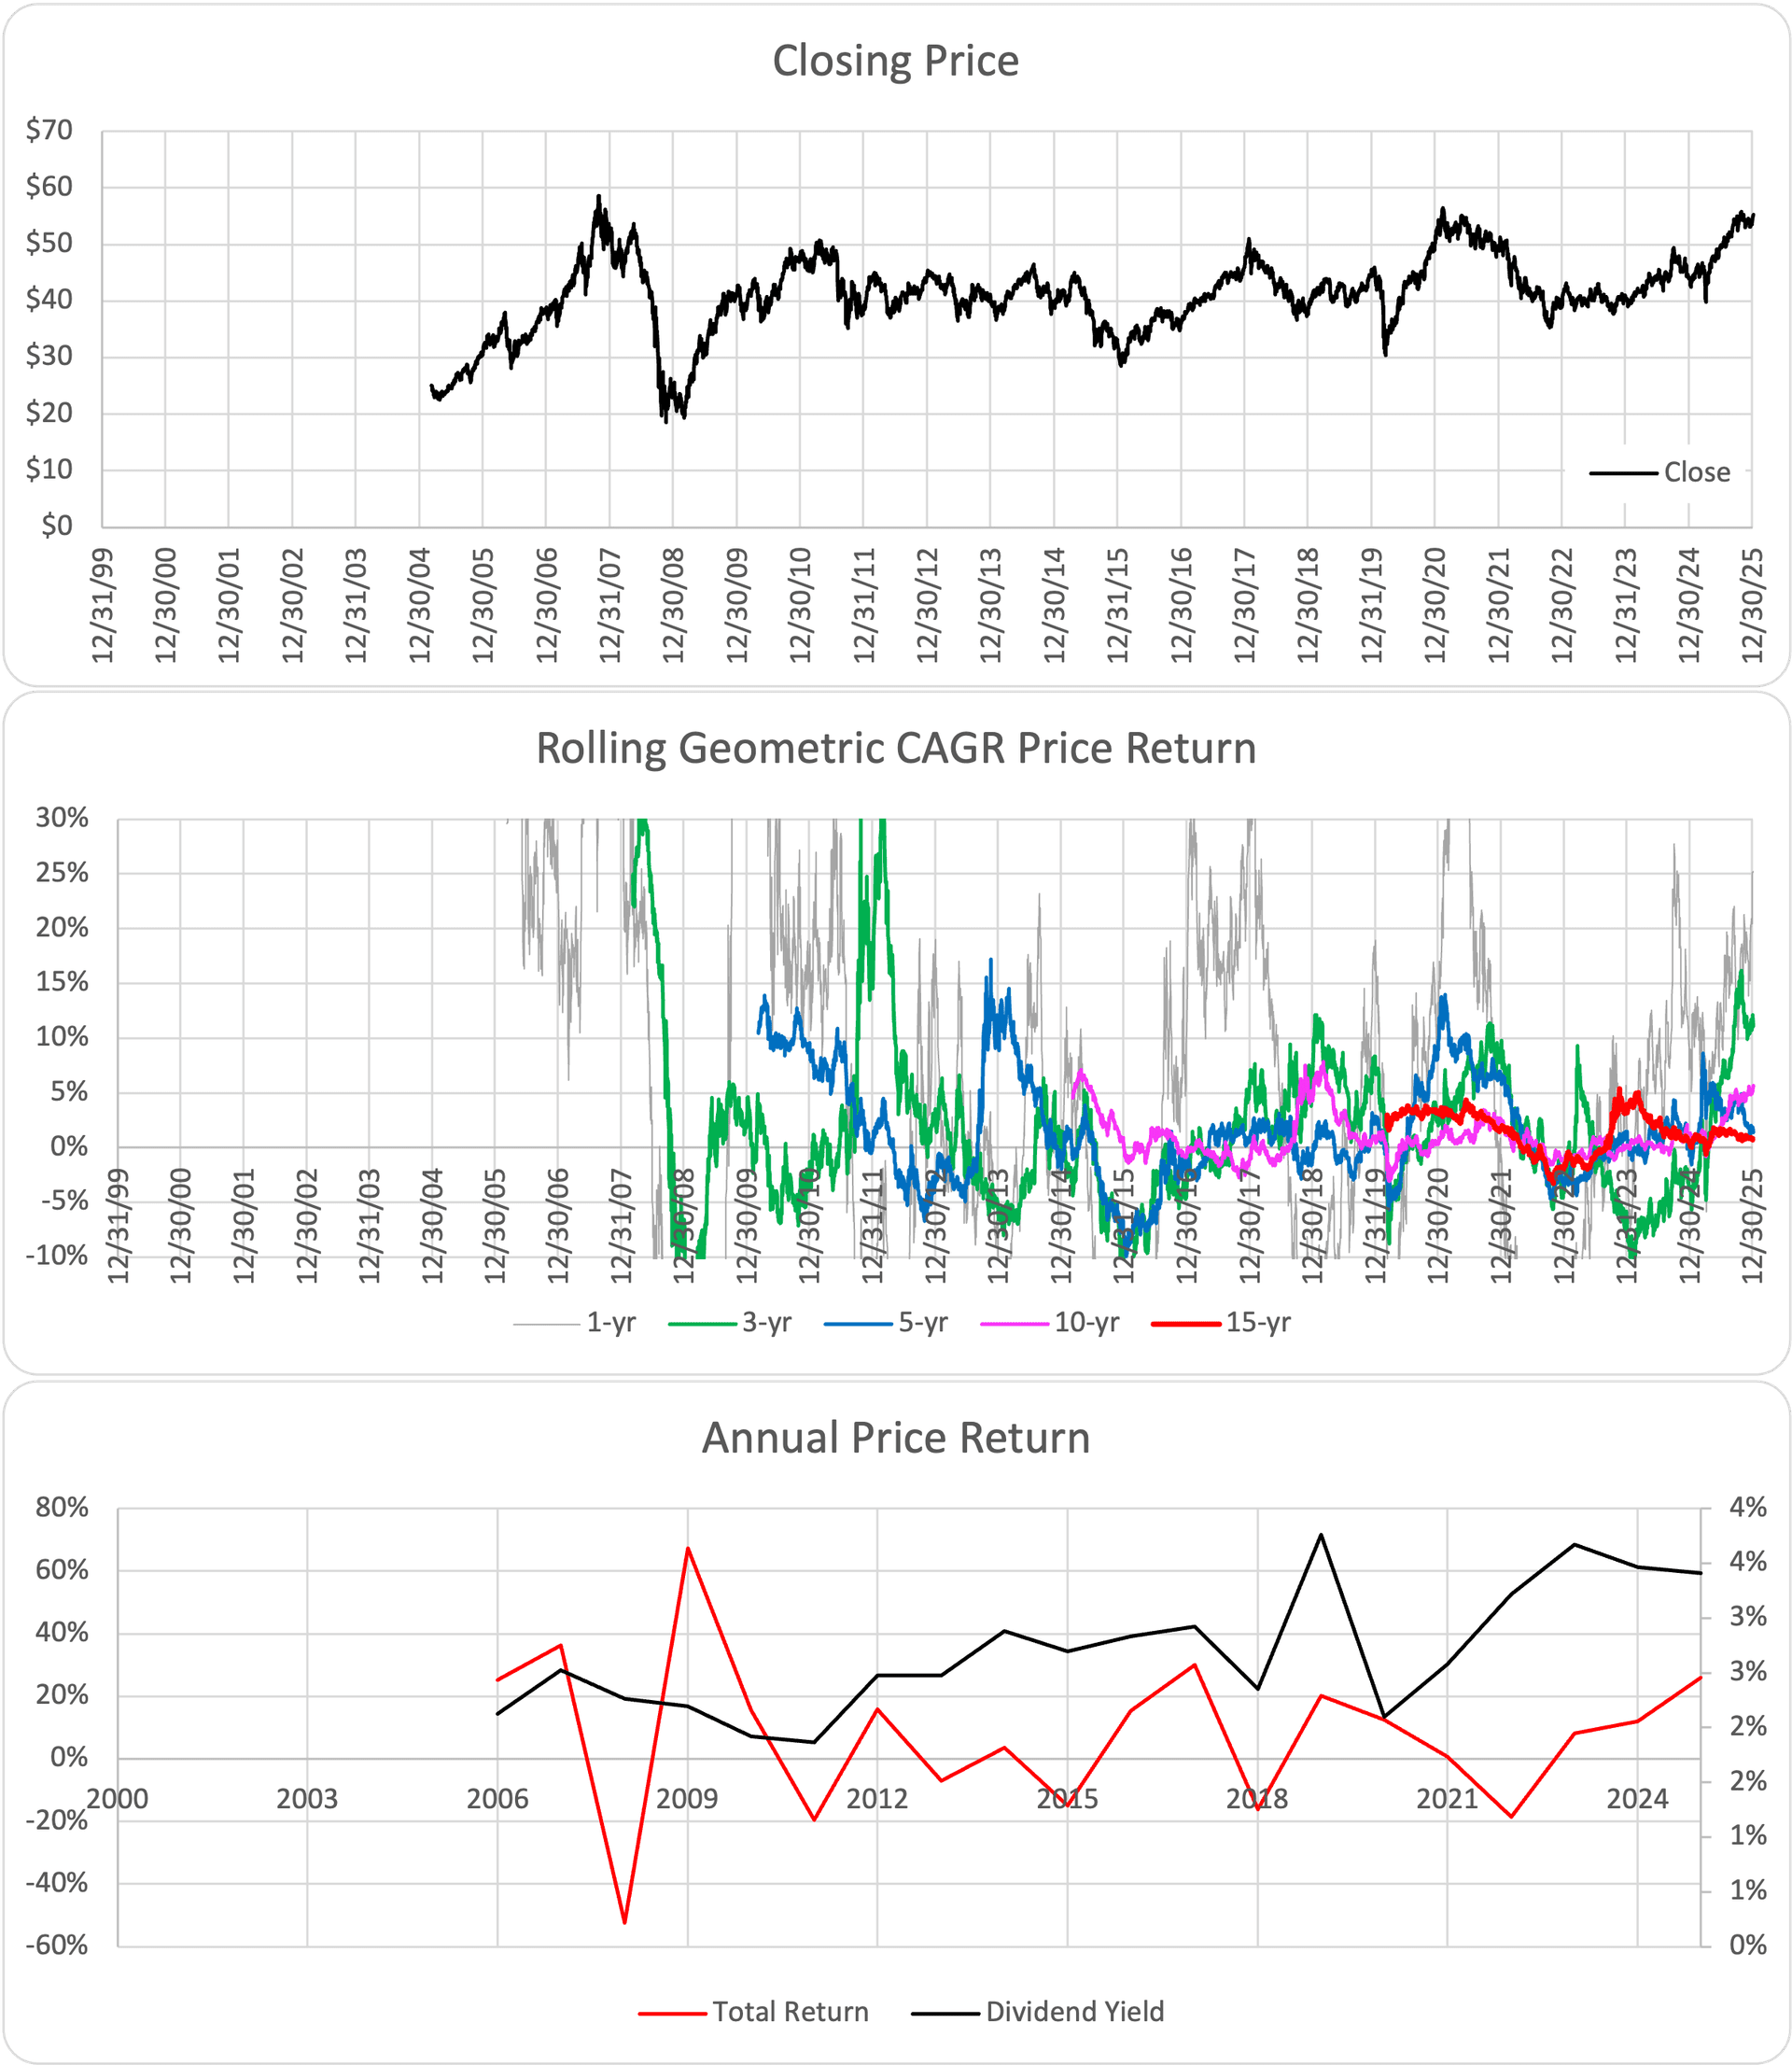
| Dates | 3/10/05 | 1/5/26 |
| Close Price | $25.08 | $55.25 |
| Adj. Price | $14.33 | $55.25 |
| # of Years | 20.8 | |
| Lifetime Price Return | 3.90% | |
| Lifetime Total Return | 6.70% | |
| Annual Return | Price Return | Total Return |
|---|---|---|
| Avg Annual Arithmetic Return | 5.30% | 8.00% |
| Geometric CAGR | 2.10% | 4.80% |
| % Positive Years | 65% | 70% |
| Avg Annual Dividend Yield | 2.70% | |
| Rolling Returns | 1-Yr | 3-Yr | 5-Yr | 10-Yr | 15-Yr |
|---|---|---|---|---|---|
| Avg Geometric CAGR-Price | 5.90% | 1.50% | 1.80% | 1.00% | 1.50% |
| Avg Geometric CAGR-Total | 8.70% | 4.30% | 4.50% | 3.80% | 4.20% |
| % Pos. Days-Price Return | 61% | 55% | 61% | 68% | 77% |
| % Pos. Days-Total Return | 66% | 72% | 84% | 100% | 99% |
Last Updated: January 5, 2026